Finance
FTSE 100: What It Is and Why It Matters

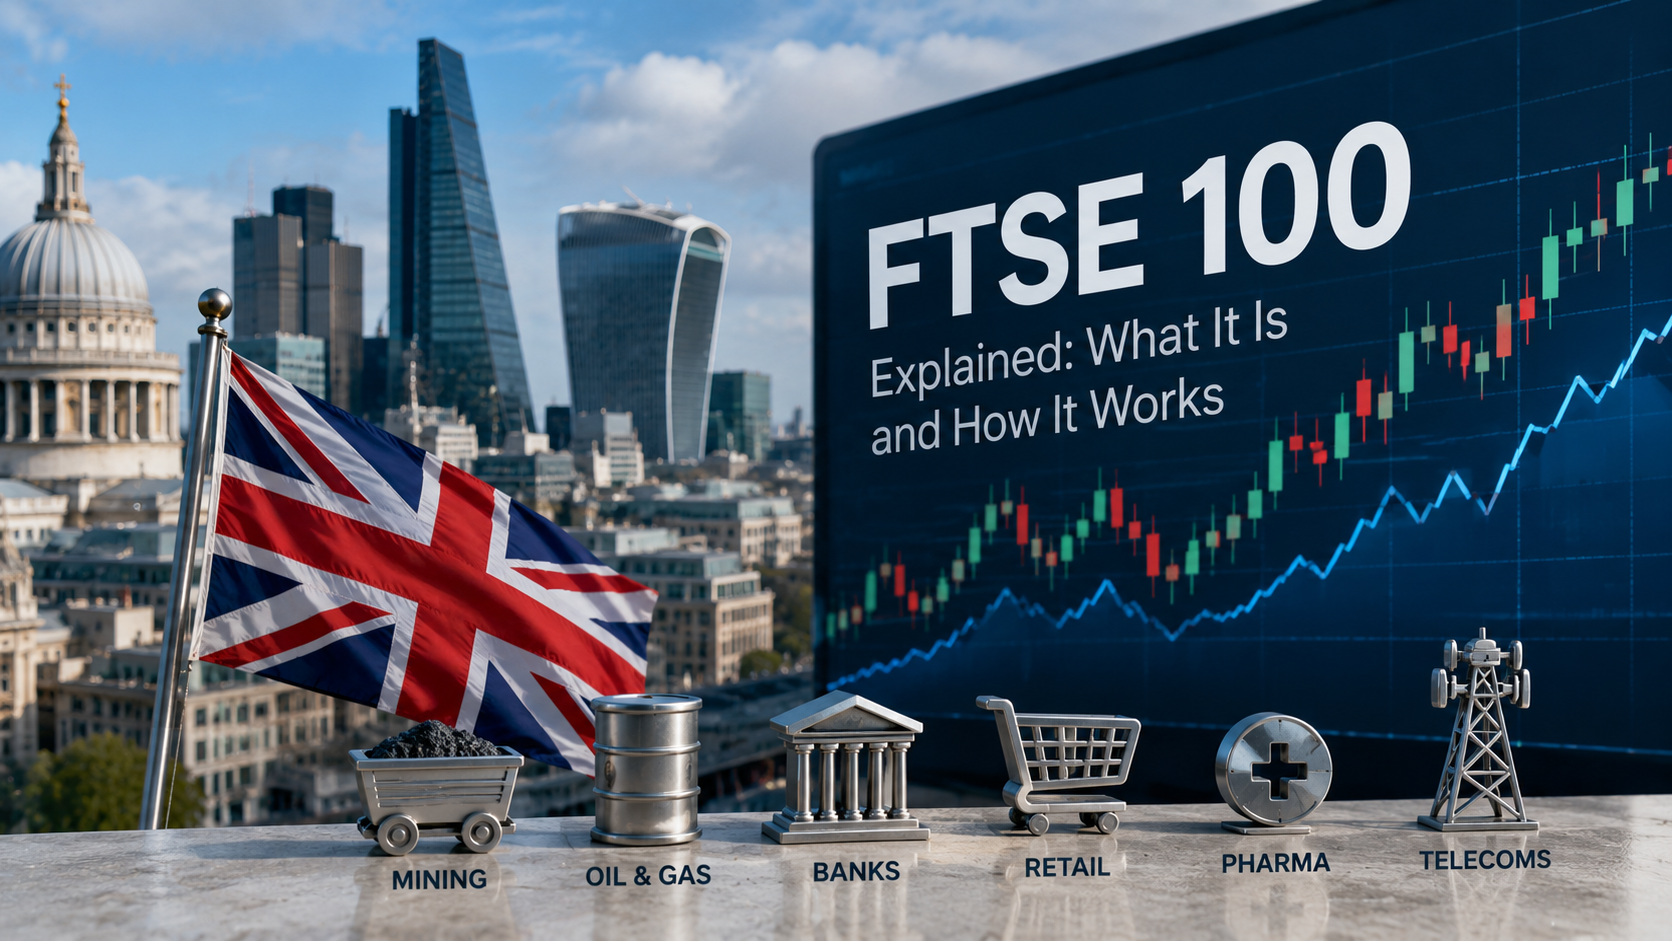
If you’ve ever caught a news anchor saying “the Footsie closed higher today,” you’ve bumped into the FTSE 100 without maybe knowing exactly what it measures. It’s one of those terms that gets thrown around constantly in financial news, yet a lot of people who hear it daily couldn’t explain what it actually tracks or why it moves the way it does.
That’s a reasonable gap to have. The FTSE 100 isn’t a single stock, a fund you can walk into a bank and buy, or a government statistic like inflation. It’s a index — a calculated number that summarizes the combined value of 100 large companies. Understanding it means understanding what those companies are, how they’re chosen, and what causes the number to rise or fall on any given day.
This article walks through all of that in plain language, without assuming you have a finance background.
Direct Answer: What Is the FTSE 100?
The FTSE 100 is the main stock market index for the United Kingdom. It tracks the 100 largest companies listed on the London Stock Exchange, ranked by market value. When people say the FTSE 100 “went up” or “went down,” they mean the combined value of those 100 companies’ shares moved in that direction. Investors, economists, and journalists use it as a quick snapshot of how big UK-listed businesses are performing. It was launched on 3 January 1984 and is maintained by FTSE Russell, a subsidiary of the London Stock Exchange Group.
Where the Name Comes From
FTSE stands for Financial Times Stock Exchange, a reflection of its origins as a joint venture between the Financial Times newspaper and the London Stock Exchange. The “100” refers to the number of companies included. In conversation, people often shorten it to “the Footsie” — a nickname that stuck because it’s easier to say out loud than the full acronym.
You’ll sometimes see it written as UKX, which is its official trading symbol on data terminals like Bloomberg and Reuters.
How the FTSE 100 Is Calculated
The index uses a method called market-capitalization weighting. Here’s what that means in practice.
Each company in the FTSE 100 has a market capitalization — the total value of all its shares multiplied by the share price. A company worth £200 billion has ten times the influence on the index as one worth £20 billion. So when a giant like AstraZeneca or HSBC moves sharply, the whole index feels it. When a smaller constituent near the bottom of the list moves the same percentage, the effect on the overall number is barely noticeable.
There’s a refinement here worth knowing: the index actually uses free-float market cap, not total market cap. Free float means only the shares that are actually available for public trading count toward the calculation. Shares held by governments, founding families, or other companies in long-term stakes are excluded, because they don’t trade freely and wouldn’t reflect real market activity.
Quarterly Reviews
The list of 100 companies isn’t fixed. FTSE Russell reviews the constituents every quarter — in March, June, September, and December. At each review, companies that have grown enough to rank among the top 100 by market cap get added, and those that have shrunk or been acquired get dropped down into the FTSE 250, which covers the next 150 largest companies. This keeps the index a genuine reflection of the largest UK-listed businesses rather than a static, outdated list.
Why the FTSE 100 Matters
It’s an Economic Barometer
Because it covers 100 of the biggest companies on the London Stock Exchange, movements in the FTSE 100 are often treated as a rough proxy for business confidence and investor sentiment toward UK-listed companies. A sustained rise usually signals optimism about corporate earnings or the broader economy; a sharp fall often reflects worry about interest rates, inflation, geopolitical events, or a slowdown.
That said, this connection is looser than people often assume — more on that in the misconceptions section below.
It Underpins Investment Products
Millions of people are exposed to the FTSE 100 without realizing it, through pension funds, workplace savings schemes, and index-tracking funds. Rather than picking individual shares, many funds simply hold all 100 companies in proportion to their weighting in the index, aiming to match its performance rather than beat it. If you have a UK pension or a stocks and shares ISA, there’s a good chance part of it is tracking, or influenced by, the FTSE 100.
It’s a Global Reference Point
International investors use the FTSE 100 alongside indices like the S&P 500 (US), the Nikkei 225 (Japan), and the DAX (Germany) to compare how different economies’ major companies are performing. Because a large share of FTSE 100 company revenue comes from outside the UK, the index also acts as an indicator of how UK-headquartered multinationals are faring globally, not purely a reading on the domestic economy.
What Kind of Companies Are in the FTSE 100
The FTSE 100 leans heavily toward what’s often called “old economy” sectors: banking, energy, mining, pharmaceuticals, and consumer staples. Financials make up the single largest sector weighting, followed by consumer staples and healthcare.
This is one of the most important things to understand about the index, because it shapes how it behaves compared to other major markets.
Some of the largest constituents by market value include:
- AstraZeneca — pharmaceuticals, one of the index’s largest members
- HSBC Holdings — one of the world’s largest banking groups
- Shell — global energy and petrochemicals
- Unilever — consumer goods
- BP — energy
Together, the handful of largest companies can account for close to a third of the entire index’s value, which is why news about any one of them — an earnings report, a regulatory fine, an oil price swing — can visibly move the FTSE 100 even though it represents just one company out of a hundred.
By contrast, the FTSE 100 has relatively light exposure to technology and fast-growing software companies compared to US indices. That’s a structural difference, not a flaw, but it explains why the FTSE 100 sometimes lags behind tech-heavy indices during periods when software and AI-related stocks are driving global market gains — and why it can hold up comparatively well when those same stocks fall.
How the FTSE 100 Compares to Other Indices
People often use “the FTSE” loosely, so it helps to know how it fits alongside its siblings:
- FTSE 100 — the 100 largest UK-listed companies by market cap
- FTSE 250 — the next 150 largest, generally considered more representative of the domestic UK economy since these companies often earn more of their revenue within the UK
- FTSE 350 — a combination of the FTSE 100 and FTSE 250
- FTSE All-Share — a broader index covering roughly 600 UK-listed companies
If you want a read specifically on how UK domestic business is doing, the FTSE 250 is often considered a more accurate gauge, precisely because the FTSE 100 is dominated by multinational giants with global operations.
Common Mistakes and Misconceptions
Mistake: “The FTSE 100 going up means the UK economy is doing well.” This is the most common misunderstanding. Because so much FTSE 100 revenue comes from overseas operations, the index can rise even during periods of weak UK domestic growth — and it can fall even when the UK economy is holding up, if it’s driven by events abroad like a drop in oil prices or a slowdown in a major overseas market. A stronger link exists with the FTSE 250, which is more UK-focused.
Mistake: “You can buy ‘the FTSE 100’ directly.” The index itself isn’t a tradable asset. What you can buy are financial products built to track it — index funds, exchange-traded funds (ETFs), or derivatives like futures and contracts for difference (CFDs). These products aim to mirror the index’s performance, but each comes with its own costs, structure, and risks.
Mistake: “A falling FTSE 100 means every company in it is losing value.” Because it’s an average weighted by size, some constituents can rise while the overall index falls, and vice versa. The headline number reflects the net effect across all 100 companies, not a uniform move.
Mistake: “The pound and the FTSE 100 always move together.” Actually, they often move in opposite directions. Because many FTSE 100 companies earn revenue in US dollars or other foreign currencies, a weaker pound can boost the reported value of that overseas income once converted back to sterling, which can push the index higher even as the currency weakens. This inverse relationship surprises a lot of newcomers to UK markets.
How to Follow FTSE 100 Movements
If you want to track the index yourself, a few reliable sources are worth knowing:
- The London Stock Exchange’s own site publishes live constituent tables and reviews
- Financial data platforms such as Bloomberg, Reuters, and Google Finance show real-time or delayed pricing
- UK financial news outlets typically report the daily open, close, and percentage change
Keep in mind that index levels you see quoted casually — on TV tickers or general news sites — are sometimes delayed by fifteen to twenty minutes rather than truly live, which matters if you’re making time-sensitive decisions.
Key Facts
- The FTSE 100 launched on 3 January 1984.
- It’s maintained by FTSE Russell, part of the London Stock Exchange Group.
- It tracks the 100 largest companies by free-float market capitalization on the London Stock Exchange’s main market.
- Constituents are reviewed and rebalanced quarterly, in March, June, September, and December.
- It’s weighted so that larger companies have proportionally more influence on the index’s movement.
- Financials, consumer staples, energy, and healthcare are historically the largest sector weightings.
- Its official ticker symbol is UKX.
Frequently Asked Questions
Q1: What is the FTSE 100?
Ans: It’s the index tracking the 100 largest companies listed on the London Stock Exchange, ranked by market value, used as the primary benchmark for UK stock market performance.
Q2: How is the FTSE 100 calculated?
Ans: It’s calculated using free-float market capitalization weighting, meaning each company’s influence on the index depends on the value of its publicly tradable shares.
Q3: Why is it called the “Footsie”?
Ans: Footsie is an informal nickname derived from the acronym FTSE, which stands for Financial Times Stock Exchange.
Q4: Can I invest directly in the FTSE 100?
Ans: Not directly, since the index itself isn’t a tradable asset. Instead, people invest through index funds, ETFs, or other financial products designed to track its performance. This is general information, not investment advice, and it’s worth understanding the costs and risks of any specific product before investing.
Q5: How often does the list of companies change?
Ans: FTSE Russell reviews the constituents quarterly, adding companies that have grown into the top 100 by market cap and removing those that have fallen out.
Q6: Does the FTSE 100 reflect the health of the UK economy?
Ans: Only loosely. Because many constituent companies earn most of their revenue abroad, the index often reflects global business conditions as much as domestic UK conditions. The FTSE 250 is generally seen as a better gauge of the UK’s domestic economy.
Q7: What sectors dominate the FTSE 100?
Ans: Financials, consumer staples, energy, and healthcare have historically made up the largest share of the index, while technology represents a comparatively small weighting compared to indices like the S&P 500.
Key Takeaways
- The FTSE 100 tracks the 100 largest companies on the London Stock Exchange by free-float market value.
- It’s weighted by market capitalization, so larger companies have more influence on its movement.
- Constituents are reviewed quarterly and can change as companies grow, shrink, or get acquired.
- It leans heavily toward financials, energy, healthcare, and consumer staples rather than technology.
- Its movements are a rough — not perfect — indicator of the UK economy, given how much constituent revenue comes from overseas.
- You can’t buy the index directly, only products designed to track it.
In Short
The FTSE 100 is a running scoreboard of the 100 biggest companies trading on the London Stock Exchange, recalculated constantly as share prices move throughout the trading day. It’s shaped heavily by a handful of large, globally focused firms in banking, energy, and pharmaceuticals, which is why its ups and downs don’t always line up neatly with what’s happening in the everyday UK economy. Understanding that distinction — between “the FTSE 100 moved” and “the UK economy moved” — is probably the single most useful thing to take away if you want to read financial headlines with a clearer eye.

Checking the Ethereum price seems simple enough — pull up an exchange, look at the number, done. But that single number reflects a mix of network activity, investor sentiment, broader crypto market trends, and Ethereum-specific developments that aren’t always obvious from a price chart alone. This guide explains what the Ethereum price actually represents, the factors that move it, and how to read price data without falling for common misunderstandings.
Direct Answer: What Is the Ethereum Price?
The Ethereum price is the current market value of one unit of Ether (ETH), Ethereum’s native cryptocurrency, typically quoted in U.S. dollars. As of late July 2026, ETH trades in roughly the $1,900 to $2,000 range, down significantly from its all-time high near $4,950 reached in August 2025. The price is determined by ongoing buying and selling activity across cryptocurrency exchanges worldwide and updates continuously in real time.
Ethereum vs. Ether: A Quick Clarification
“Ethereum” refers to the blockchain network and platform itself, while “Ether,” abbreviated ETH, is the cryptocurrency that runs on that network. In everyday conversation, people often say “Ethereum price” to mean the price of ETH, and that’s the common usage this article follows, but the distinction matters if you’re trying to understand what’s technically being priced: it’s the token, not the network.
How the Ethereum Price Is Determined
Like most cryptocurrencies, ETH doesn’t have a centrally set price. Instead, its value comes from continuous trading activity on exchanges, where buyers and sellers agree on a price for each transaction. Because ETH trades on many exchanges simultaneously, the “price” you see on any given platform is essentially an aggregated or exchange-specific snapshot of recent trading activity, which is why prices can vary slightly, though not usually significantly, from one source to another.
Unlike a company’s stock price, ETH isn’t backed by earnings, dividends, or a claim on a physical business. Its value is driven by network usage, investor demand, broader crypto market sentiment, and expectations about Ethereum’s future role in decentralized finance, applications, and blockchain infrastructure.
What Drives Ethereum’s Price Up or Down
Network Usage and Adoption
Ethereum supports a large share of decentralized applications, DeFi (decentralized finance) platforms, and token projects, since most other tokens are built using Ethereum’s technical standards. Higher usage of the network, measured through transaction volume and the number of active applications, tends to support increased demand for ETH, since it’s needed to pay transaction fees, known as gas fees.
Staking Activity
Since 2022, Ethereum has run on a proof-of-stake system rather than the energy-intensive proof-of-work mining model it originally used. Under proof-of-stake, holders can “stake” their ETH to help validate transactions and earn rewards in return. Staking activity affects the amount of ETH actively circulating in the market versus locked up, which can influence price dynamics over time.
Broader Crypto Market Sentiment
ETH’s price tends to move alongside the broader cryptocurrency market, including Bitcoin, even when the news driving that sentiment isn’t specific to Ethereum itself. Regulatory announcements, macroeconomic shifts like interest rate changes, and major developments at large exchanges can move the entire crypto market together, ETH included.
Protocol Upgrades and Technical Developments
Ethereum periodically undergoes network upgrades aimed at improving speed, cost, or scalability. Major upgrades can shift market sentiment, sometimes positively if they’re seen as strengthening the network’s long-term position, though the actual price impact of any single upgrade is difficult to predict in advance.
Competition From Other Blockchains
Ethereum isn’t the only smart-contract platform. Competing blockchains offering faster transactions or lower fees can pull developer and user activity away from Ethereum, which can weigh on demand for ETH, while renewed developer interest in Ethereum’s ecosystem can work in the opposite direction.
How Ethereum’s Price Compares to Bitcoin’s
Ethereum and Bitcoin are often discussed together, but they serve different purposes. Bitcoin functions primarily as a digital store of value, often compared to digital gold, with a fixed maximum supply of 21 million coins. Ethereum functions as a broader computing platform, supporting smart contracts and decentralized applications, with no fixed maximum supply in the same way Bitcoin has.
Because of these different roles, ETH and Bitcoin don’t always move in perfect lockstep, even though both are generally influenced by overall crypto market sentiment. Some investors track the “ETH/BTC ratio,” which shows Ethereum’s price relative to Bitcoin’s, as a way of gauging whether ETH is gaining or losing relative strength within the broader crypto market.
How to Track the Ethereum Price Accurately
- Use a reputable exchange or data aggregator. Sites like major exchanges or crypto data platforms provide continuously updated pricing based on real trading activity.
- Check the timestamp. Crypto prices move constantly, so a number without a clear “last updated” timestamp may not reflect the current market.
- Look at more than one source if precision matters. Prices can vary slightly across exchanges due to differences in trading volume and liquidity, so comparing a couple of sources gives a more accurate picture than relying on just one.
- Understand the difference between spot price and other figures. The “price” you see is typically the spot price, the current rate for immediate trades. It’s different from futures prices or staking reward figures, which represent different things entirely.
- Watch percentage change alongside the raw number. A price alone doesn’t tell you much without context. Most platforms show 24-hour, 7-day, and longer-term percentage changes, which give a clearer sense of recent momentum.
Common Mistakes and Misconceptions
Mistake: Assuming a “cheaper” price means better value. ETH’s dollar price doesn’t reflect anything about whether it’s undervalued or overvalued. A lower price compared to another cryptocurrency says nothing on its own about which is the better investment; supply, market cap, and adoption all matter more than the raw price of one unit.
Misconception: Ethereum’s price is set by a company or foundation. No single entity sets ETH’s price. It’s determined entirely by decentralized market trading across global exchanges.
Mistake: Confusing short-term price swings with the network’s underlying health. Ethereum’s price can swing sharply in short periods due to market sentiment, while network usage, developer activity, and technical development continue on a much slower, steadier timeline. The two don’t always move together.
Misconception: Historical highs guarantee the price will return there. Ethereum’s past all-time high isn’t a floor or a target. Past price levels reflect a specific set of market conditions at that time, which may or may not repeat.
Real-World Example
Imagine someone checking Ethereum’s price after hearing about a major network upgrade in the news. They notice ETH’s price barely moved that day, despite what seemed like significant news. This is a common pattern: markets often price in expected events ahead of time, meaning much of the sentiment shift already happened in the days or weeks leading up to the announcement, rather than on the day it’s finalized. Understanding this helps explain why price reactions to news don’t always match the size of the news itself.
Key Facts
- Ethereum (the network) and Ether/ETH (the cryptocurrency) are related but distinct terms, often used interchangeably in casual usage.
- ETH’s price is determined by continuous trading activity across global exchanges, not set by a central authority.
- Ethereum moved to a proof-of-stake system in 2022, replacing its original energy-intensive mining model.
- ETH reached an all-time high near $4,950 in August 2025 before declining significantly.
- Ethereum’s price is influenced by network usage, staking activity, broader crypto sentiment, protocol upgrades, and competition from other blockchains.
FAQ
Q1: What is the Ethereum price right now?
Ans: It changes continuously based on live trading activity. As of late July 2026, ETH trades in roughly the $1,900 to $2,000 range, though checking a live exchange or data aggregator gives the most current figure.
Q2: Why does Ethereum’s price change so much?
Ans: ETH has no earnings or cash flow to anchor its value the way a stock does, so its price reflects shifting market sentiment, network usage, staking dynamics, and broader crypto market trends, all of which can shift quickly.
Q3: Is Ethereum’s price the same on every exchange?
Ans: It’s usually very close but not always identical. Minor differences between exchanges are normal due to variations in trading volume and liquidity.
Q4: How is Ethereum’s price different from Bitcoin’s?
Ans: Both are influenced by overall crypto sentiment, but Ethereum functions as a computing and applications platform, while Bitcoin is generally treated as a store of value, so the two don’t always move in the same direction or by the same amount.
Q5: Does staking affect Ethereum’s price?
Ans: Staking can influence how much ETH is actively circulating on exchanges versus locked up in the network, which is one of several factors that can affect supply-and-demand dynamics over time.
Q6: What’s the safest way to check Ethereum’s current price?
Ans: Use a reputable, well-known exchange or crypto data platform, and check the timestamp to make sure you’re looking at current, not cached, data.
Key Takeaways
- Ethereum’s price reflects continuous global trading activity for ETH, its native cryptocurrency.
- Key price drivers include network usage, staking activity, broader crypto sentiment, protocol upgrades, and competition from other blockchains.
- ETH and Bitcoin often move together directionally but serve different roles and don’t move identically.
- Historical price highs aren’t a guarantee of future price levels.
- Checking multiple reputable sources and paying attention to timestamps gives the most accurate current price picture.
Conclusion
The Ethereum price is more than a single number on a chart — it’s a live reflection of network activity, investor sentiment, and broader crypto market conditions all moving at once. Understanding what actually drives that number, from staking dynamics to competition among blockchains, makes the price far more meaningful than looking at it in isolation. For anyone tracking ETH regularly, pairing the current price with context like recent percentage changes and network developments gives a much clearer picture than the number alone.
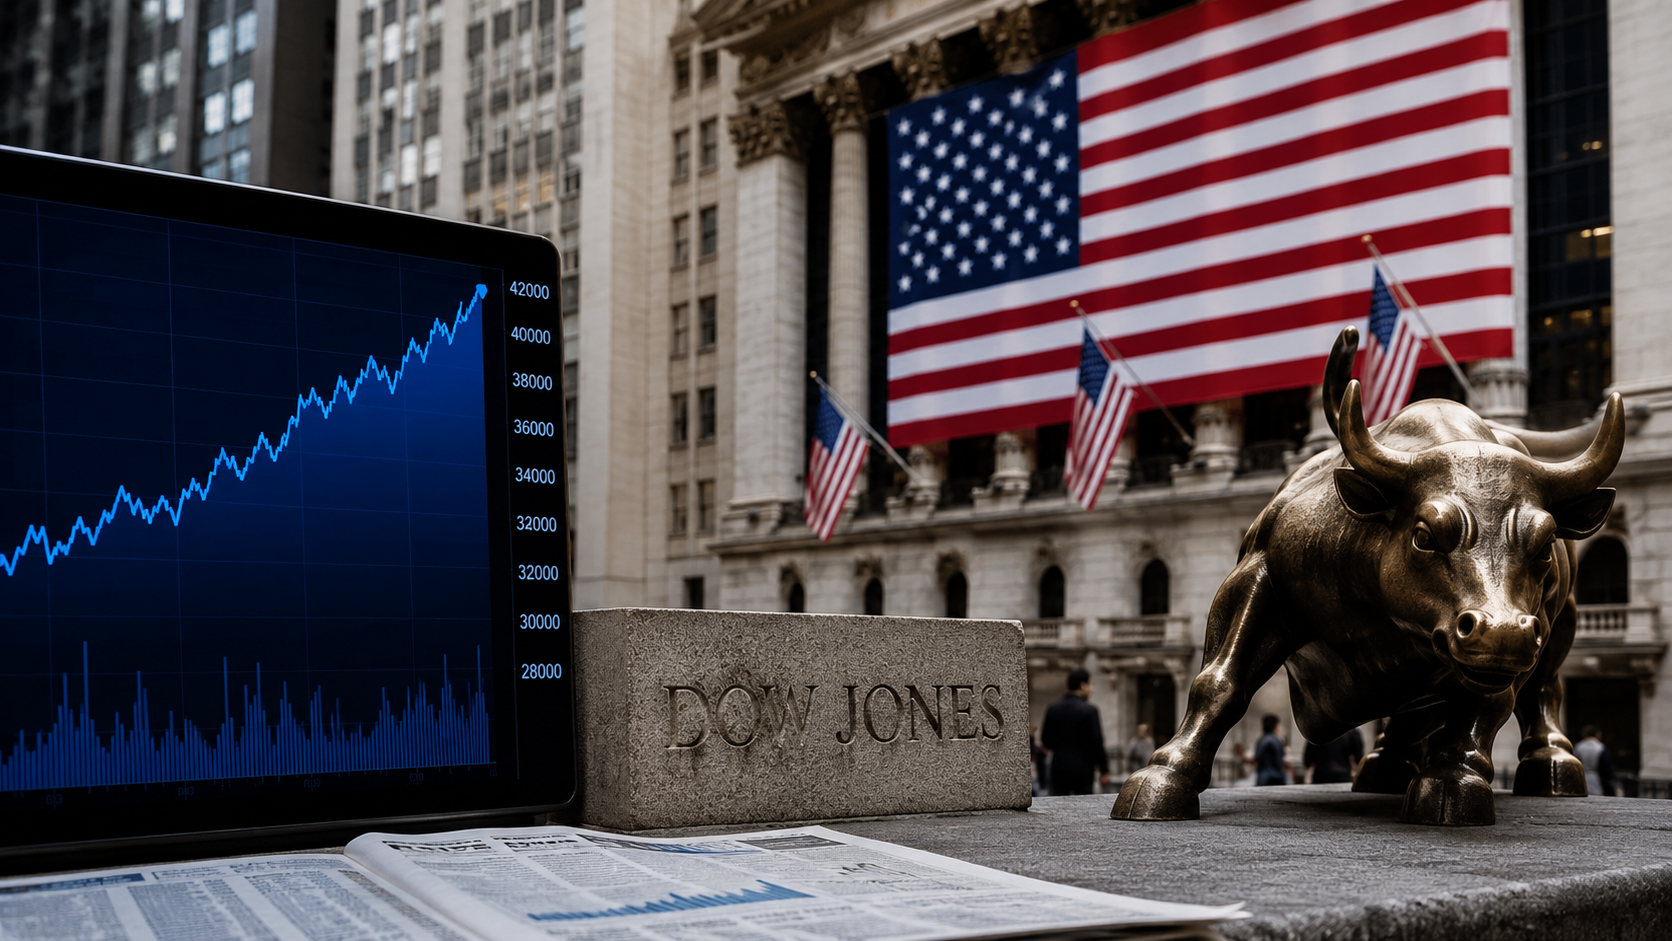
Turn on any business news broadcast and within minutes you’ll hear someone mention “the Dow.” It’s treated as shorthand for how the US stock market is doing overall, the way a weather report gets treated as shorthand for the whole day ahead. But the DJIA is a much narrower, more specific thing than most casual references suggest, and understanding what it actually measures changes how much weight you should give it.
This article breaks down what the DJIA is, how it’s built, why it behaves the way it does, and where it falls short as a stand-in for “the market.”
Direct Answer: What Is the DJIA?
The DJIA, or Dow Jones Industrial Average, is a stock market index that tracks 30 large, publicly traded US companies. Unlike most major indices, it’s price-weighted rather than weighted by company size, meaning stocks with higher share prices influence the index more than stocks with lower share prices, regardless of the company’s total value. Created in 1896, it’s one of the oldest and most widely cited market benchmarks in the world, maintained today by S&P Dow Jones Indices.
Where the Name Comes From
The index is named after two people: Charles Dow, a financial journalist and co-founder of Dow Jones & Company, and Edward Jones, his business partner and a statistician. Together they created it as a simple way to track the general direction of industrial-era American business. The original 1896 version included just 12 companies, almost all tied to heavy industry — railroads, sugar, tobacco, and gas. Today’s version has grown to 30 companies and covers a much broader mix of industries, from technology to healthcare to financial services, even though it still carries the word “Industrial” in its name as a nod to its origins.
How the DJIA Is Calculated
This is where the DJIA differs most sharply from indices like the S&P 500 or FTSE 100, and it’s worth slowing down on.
Price-Weighting, Not Market-Cap Weighting
Most modern indices weight companies by market capitalization — total company value. The DJIA does something older and simpler: it weights companies by their share price. A company whose stock trades at $500 a share has a bigger effect on the index’s movement than a company whose stock trades at $50 a share, even if the $50 company is worth far more overall in total market value.
This creates a genuinely odd effect. As Google Finance has noted, a company like Goldman Sachs can carry more weight in the DJIA than a company like Apple, purely because of share price differences, even though Apple’s total market value is many times larger. It’s a quirk that catches a lot of people off guard once they learn about it, because it seems to work backward from what you’d intuitively expect an “important companies” index to do.
The Divisor
Because stock splits and company substitutions would otherwise throw off comparisons over time, the DJIA uses something called the Dow Divisor — a constantly adjusted number that keeps the index consistent even as individual components change or split their shares. You don’t need to calculate this yourself to understand the index, but it’s worth knowing it exists, since it’s the technical reason the DJIA can still be meaningfully compared to its value decades ago despite dozens of changes to its lineup.
Why the DJIA Matters
It’s a Long-Running Historical Benchmark
Few financial measures have the track record the DJIA has. Because it stretches back to 1896, it offers one of the longest continuous records of US market performance available, which makes it a common reference point in historical and economic research, even though newer indices are often considered more statistically representative today.
It Reflects Blue-Chip Sentiment
The 30 companies in the DJIA are generally large, established, financially stable businesses — often called “blue chips.” Movements in the index are frequently read as a signal of how investors feel about mature, dependable American companies specifically, as opposed to the broader market, which includes thousands of smaller and higher-risk companies.
It’s Deeply Embedded in Financial Media and Culture
Rightly or wrongly, “the Dow” has become the default shorthand journalists and casual investors reach for when talking about “the market.” That familiarity gives it outsized cultural relevance even among people who couldn’t name more than a few of its actual components.
What Companies Are in the DJIA
The DJIA’s 30 components span a range of sectors, deliberately avoiding overconcentration in any single industry, though the mix shifts periodically as the committee that oversees the index swaps companies in and out to keep it representative of the broader economy. Unlike an index with fixed, rules-based inclusion criteria, DJIA changes are decided by a committee at S&P Dow Jones Indices, which considers a company’s reputation, growth, and relevance to American industry rather than following a strict formula.
Notably, the DJIA excludes transportation and utility companies, which are tracked separately by their own related indices — the Dow Jones Transportation Average and the Dow Jones Utility Average.
DJIA vs. Other Major Indices
It helps to see where the DJIA fits next to the other indices you’ll hear about constantly in US financial news:
- DJIA — 30 large companies, price-weighted, one of the oldest indices
- S&P 500 — roughly 500 large companies, market-cap weighted, generally considered more representative of the broader US market
- Nasdaq Composite — thousands of companies listed on the Nasdaq exchange, heavily weighted toward technology
Because the S&P 500 covers so many more companies and uses market-cap weighting, many professional investors and economists treat it as a more accurate gauge of overall US market performance than the DJIA. The Dow persists mainly because of its history, simplicity, and name recognition, not because it’s considered the most statistically sound measure available.
Common Mistakes and Misconceptions
Mistake: “The Dow represents the whole US stock market.” It represents 30 companies out of many thousands publicly traded in the US. It’s a useful snapshot of blue-chip sentiment, not a comprehensive picture of the market as a whole.
Mistake: “A bigger company always moves the Dow more.” Because the index is price-weighted rather than value-weighted, this isn’t true. A company with an unusually high share price can swing the index more than a company that’s actually worth far more in total market capitalization.
Mistake: “The Dow and the economy always move together.” The DJIA reflects investor expectations about corporate earnings and outlook, which can diverge from real-time economic conditions. Markets often move on anticipation of future events — interest rate decisions, earnings forecasts, geopolitical developments — rather than strictly reflecting the present state of the economy.
Mistake: “You can invest directly in the Dow.” As with any index, the DJIA itself isn’t something you buy. What exists are financial products, such as index funds and exchange-traded funds, designed to mirror its performance as closely as possible.
How to Follow DJIA Movements
If you want to track it yourself, a few dependable sources include:
- Financial data platforms like Yahoo Finance, MarketWatch, and Google Finance, which offer live or lightly delayed pricing
- S&P Dow Jones Indices, the official index provider, for methodology details and constituent changes
- Major financial news outlets, which typically report the day’s open, close, and percentage move
Numbers quoted on general news broadcasts or casual news sites are sometimes delayed rather than truly live, so if timing matters for a decision you’re making, go to a source built for real-time data.
Key Facts
- The DJIA was created in 1896 by Charles Dow and Edward Jones.
- It originally tracked 12 companies; today it tracks 30.
- It’s price-weighted, not market-cap weighted, unlike most modern indices.
- Component changes are decided by a committee at S&P Dow Jones Indices, not a fixed formula.
- Transportation and utility companies are excluded and tracked by separate related indices.
- The S&P 500 is generally considered a more statistically representative gauge of the broader US market.
Frequently Asked Questions
Q1: What does DJIA stand for?
Ans: DJIA stands for Dow Jones Industrial Average, a stock market index tracking 30 large US companies.
Q2: How is the DJIA calculated?
Ans: It’s calculated using price-weighting, meaning a company’s share price, rather than its total market value, determines how much it influences the index. A divisor is used to keep the calculation consistent through stock splits and component changes.
Q3: Is the DJIA the same as the stock market?
Ans: No. It’s one specific index covering 30 companies, not the entire market. Broader indices like the S&P 500 cover far more companies and are generally seen as more representative.
Q4: Can I invest directly in the DJIA?
Ans: Not directly. You can invest in funds or financial products built to track its performance, but the index itself isn’t a purchasable asset. This is general information rather than investment advice, and it’s worth researching the specific costs and risks of any product before investing.
Q5: How often do the companies in the DJIA change?
Ans: There’s no fixed schedule. A committee at S&P Dow Jones Indices reviews the index periodically and makes changes when they judge a company no longer reflects the mix of American industry the index is meant to represent.
Q6: Why doesn’t the DJIA include tech giants proportional to their size?
Ans: Because the index is price-weighted, a company’s total value doesn’t directly determine its influence — its share price does. This means some very large companies by market cap can still carry relatively modest weight in the DJIA.
Q7: Is the DJIA a good indicator of economic health?
Ans: It’s a useful but limited signal. It reflects investor sentiment toward 30 large companies, which can move for reasons connected to future expectations rather than present economic conditions, and it doesn’t capture smaller or newer companies at all.
Key Takeaways
- The DJIA tracks 30 large US companies and is one of the oldest stock indices in the world.
- It uses price-weighting, an older and less common method than the market-cap weighting used by most modern indices.
- A committee, not a fixed formula, decides which companies are included.
- It’s a useful cultural and historical benchmark, but a limited one, covering a small slice of the total US market.
- The S&P 500 is generally viewed as a more comprehensive measure of overall US market performance.
- You can’t buy the DJIA directly, only funds designed to track it.
In Short
The DJIA has earned its place in financial vocabulary through more than a century of continuous history, but its age comes with real limitations. Because it only tracks 30 companies and weights them by share price rather than actual size, it can move in ways that don’t line up with the broader market or the real economy. Reading “the Dow was up today” with a clear understanding of what that number actually represents — and what it leaves out — makes financial headlines a lot easier to interpret accurately.
-

 Technology2 months ago
Best Wireless Earbuds Under 200 Dollars 2024: What to Know Before You Buy
-

 News4 months ago
Best Places to See Penguins in the Wild: A Complete Guide
-

 Technology4 months ago
What Is VIPstand? How It Works, Legal Risks, and What You Should Know
-

 News4 months ago
Lake Mead Water Levels: Status, History & Western Impact
-

 Technology4 months ago
Laaster: Meaning, Origins, and What It Says About Harmful Speech
-

 Celebrity4 months ago
Matt Danzeisen: Who He Is, His Career in Finance, and His Life With Peter Thiel
-

 News4 months ago
What Is Epoch Fun? A Complete Guide to the Epoch Times Games Section
-

 Food2 months ago
Best Arroz con Leche Boliviano Near Me: What to Look For